JEE MAIN 2026Motion graphs: x-t, v-t and a-tTRANSCRIBED
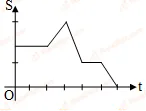
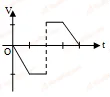
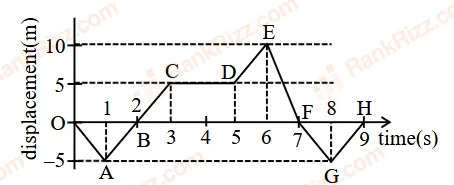
The best representing velocity -time () graph corresponding to displacement -time ( ) graph shown is
- A
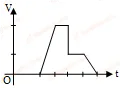
- B
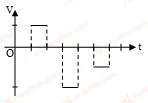
- C
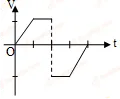
- D
Every JEE Main question on Motion graphs: x-t, v-t and a-t, one of the ideas inside Motion in a Straight Line: 30 questions from 2008–2026, 13 of them in the last five years. Newest first, answer key on every one. Free to read.
Questions
30
Years asked
12
Since
2008
Of the chapter
22%
Questions on Motion graphs: x-t, v-t and a-t in each year it was asked.
1–20 OF 30 · NEWEST FIRST
The best representing velocity -time () graph corresponding to displacement -time ( ) graph shown is
The velocity (v) versus time (t) plot of a particle is shown in the figure, for a time interval of 40 s. The total distance travelled by the particle and the and the average velocity during this period are, respectively___________,
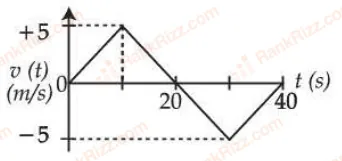
25 m and zero
50 m and zero
100 m and zero
100 m and 2.5 m/s
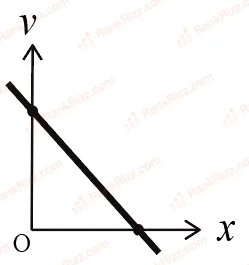
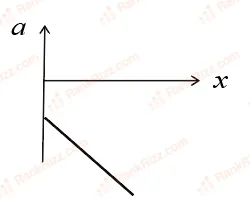
The velocity (v) - Distance (x) graph is shown in figure. Which graph represents accderation(a) versus distance (x) variation of this system?
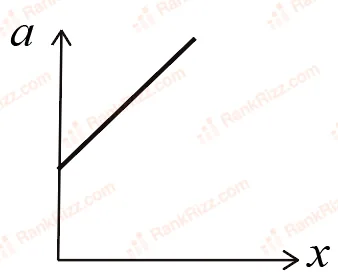
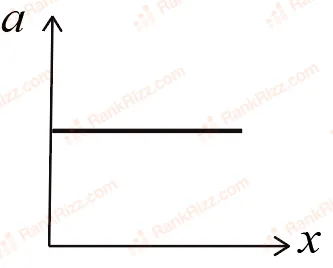
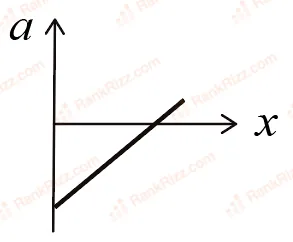
The velocity-time graph of an object moving along a straight line is shown in the figure. What is the distance covered by the object between t = 0 to t = 4 s ?
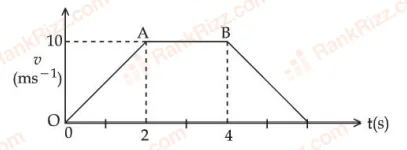
30 m
11 m
10 m
13 m
Which of the following curves possibly represent one-dimensional motion of a particle ?
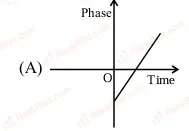
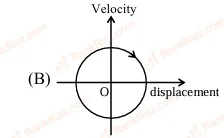
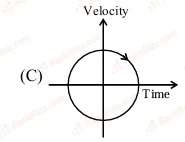
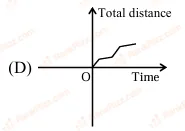
Choose the correct answer from the options given below :
A, B and D only
A, B and C only
A and B only
A, C and D only
The displacement x versus time graph is shown below.
(A) The average velocity during 0 to 3 s is 10 m/s
(B) The average velocity from 3 to 5 s is 0 m/s
(C) The instantaneous velocity at t = 2 s is 5 m/s
(D) The average velocity during 5 to 7 s and instantaneous velocity at t = 6.5 s are equal
(E) The average velocity from t = 0 to t = 9 s is zero
Choose the correct answer from the options given below:
(A), (D), (E) only
(B), (C), (D) only
(B), (D), (E) only
(B), (C), (E) only
The motion of an airplane is represented by velocity-time graph as shown below. The distance covered by
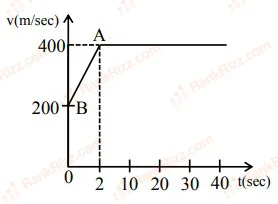
airplane in the first 30.5 second is _______ km .
12
3
6
9
Match Column-I with Column-II:
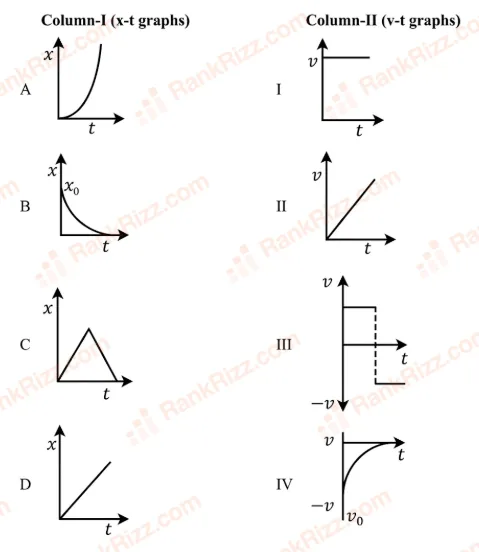
Choose the correct answer from the options given below:
A-II B-IV, C-III, D-I
A-I, B-II, C-III, D-IV
A-II B-III, C-IV, D-I
A-I, B-III, C-IV, D-II
Given below are two statements:
Statement I: Area under velocity-time graph gives the distance travelled by the body in a given time.
Statement II: Area under acceleration-time graph is equal to the change in velocity in the given time.
In the light of given statements, choose the correct answer from the options given below.
Both Statement I and Statement II are true
Both Statement I and Statement II are false
Statement I is correct but Statement II is false
Statement I is incorrect but Statement II is true
The position-time graphs for two students A and B returning from the school to their homes are shown in figure.
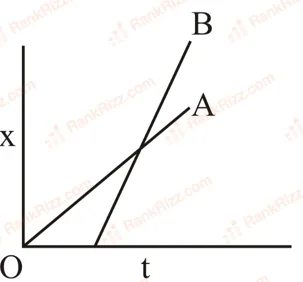
(A) A lives closer to the school
(B) B lives closer to the school
(C) A takes lesser time to reach home
(D) A travels faster than B
(E) B travels faster than A
Choose the correct answer from the options given below
A, C and D only
A, C and E only
B and E only
A and E only
From the graph shown, the ratio of distance to displacement in 25 s of motion is:
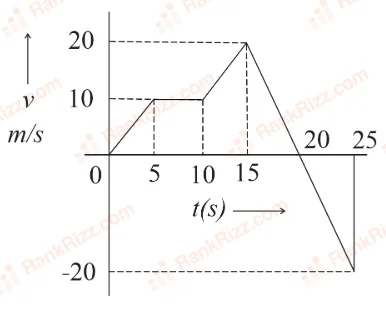
1
The velocity-time graph of a body moving in a straight line is shown in figure.
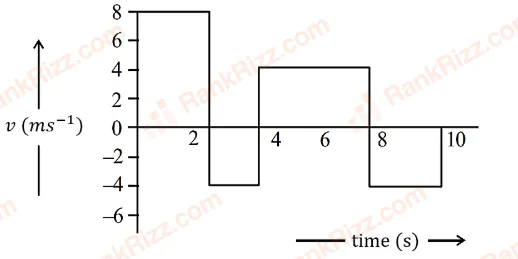
The ratio of displacement and distance travelled by the body in time 0 to 10 s is
1 : 1
1 : 2
1 : 3
1 : 4
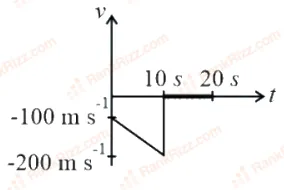
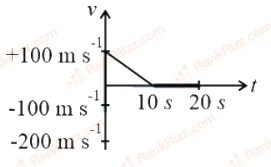
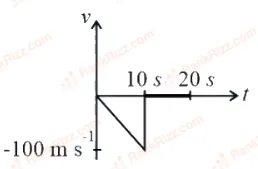
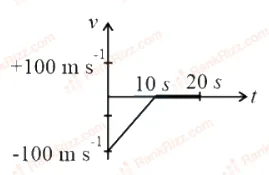
A bullet is shot vertically downwards with an initial velocity of from a certain height. Within , the bullet reaches the ground and instantaneously comes to rest due to the perfectly inelastic collision. The velocity-time curve for total time will be: (Take )
The velocity-displacement graph describing the motion of a bicycle is shown in the figure.
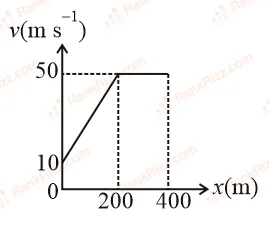
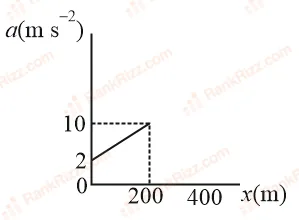
The acceleration-displacement graph of the bicycle's motion is best described by:
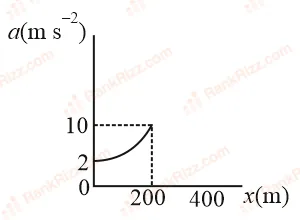
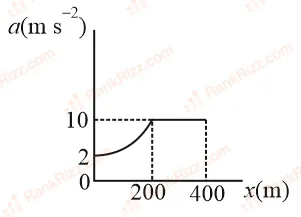
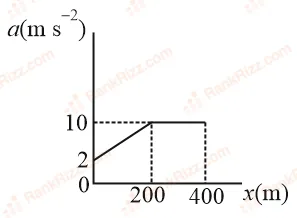
The velocity-displacement graph of a particle is shown in the figure.
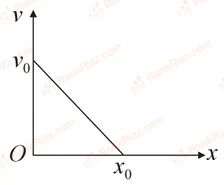
The acceleration-displacement graph of the same particle is represented by :
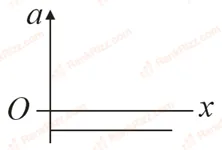
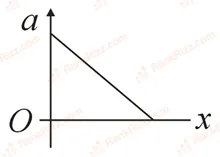
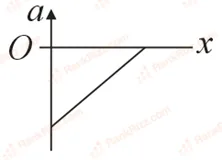
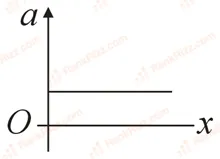
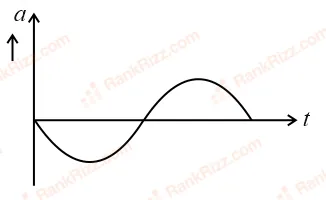
If the velocity-time graph has the shape AMB, what would be the shape of the corresponding acceleration-time graph?
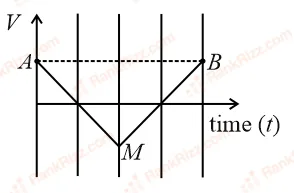
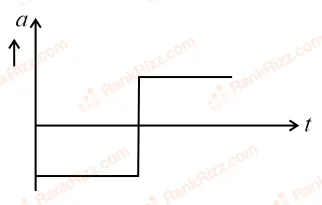
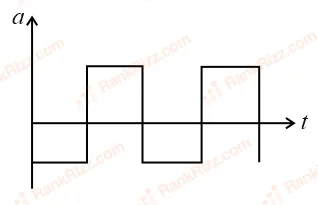
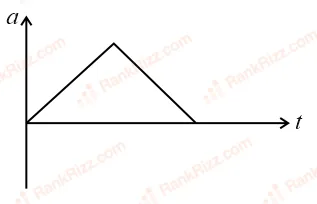
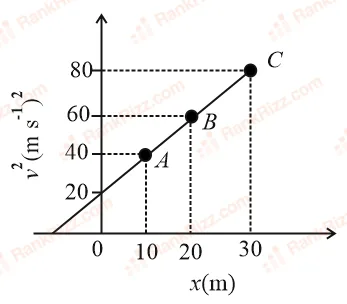
A particle is moving with constant acceleration . Following graph shows versus (displacement) plot. The acceleration of the particle is _________ m s.
The velocity and time graph of a body in a straight line motion is shown in the figure. The point is at seconds. The total distance covered by the body in s is:
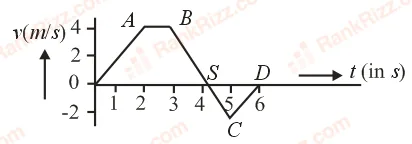
m
12 m
11 m
m
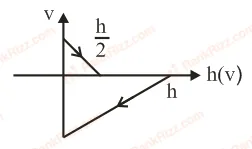
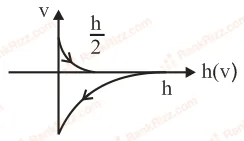
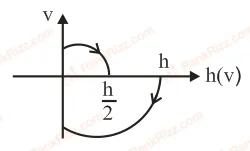
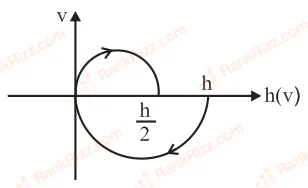
A tennis ball is released from a height h and after freely falling on a wooden floor it rebounds and reaches height h/2. The velocity versus height of the ball during its motion may be represented graphically by: (graphs are drawn schematically and on not to scale)
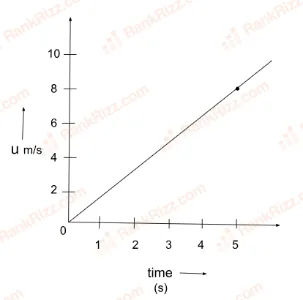
The speed versus time graph for a particle is shown in the figure. The distance travelled (in m) by the particle during the time interval t = 0 to t = 5 s will be __________
RELATED MOTION IN A STRAIGHT LINE TOPICS