JEE Main 2023 Physics question — Motion graphs: x-t, v-t and a-t
The position-time graphs for two students A and B returning from the school to their homes are shown in figure.
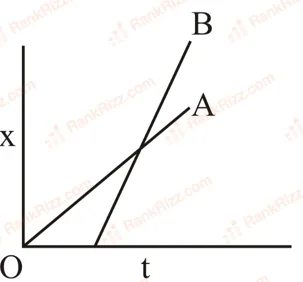
(A) A lives closer to the school
(B) B lives closer to the school
(C) A takes lesser time to reach home
(D) A travels faster than B
(E) B travels faster than A
Choose the correct answer from the options given below
SOLUTION
look at the graph slowly and interpret each thing correctly
horizontal axis time
vertical axis position (distance from school)
both students start from school (origin)
now key ideas
slope of line = speed
final height = how far their home is
final time coordinate = time taken
- time taken
both lines end at the same time coordinate on x-axis
so both students reach home at the same time
so A does NOT take lesser time
(C) is wrong
2.who is faster
compare slopes
line B is steeper than A
steeper line greater slope higher speed
so B is faster
(E) is correct
(D) is wrong
3. who lives closer
compare final heights (end points on y-axis)
B’s endpoint is higher B has travelled more distance
so B lives farther
A’s endpoint is lower A lives closer
so (A) is correct
(B) is wrong
final answer: A and E
Tagged Motion graphs: x-t, v-t and a-t. Machine-assigned, so read it as a strong shortlist rather than a verdict.