JEE Main 2023 Physics question — Motion graphs: x-t, v-t and a-t
From the graph shown, the ratio of distance to displacement in 25 s of motion is:
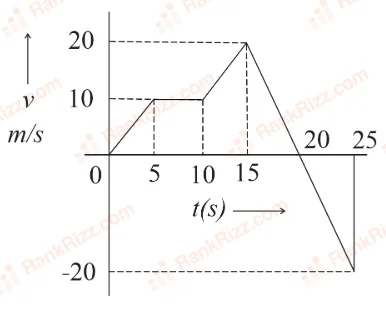
SOLUTION
The shaded region under a graph always gives displacement when the sign (above / below the time-axis) is taken into account and gives distance when only the magnitude of the area is added.
From the given graph it is seen that:
• For the first the velocity is constant and positive (the horizontal line at height ).
Area (rectangle)
• For the next (from to ) the velocity is the same in magnitude but negative (the horizontal line at depth ).
Area (rectangle)
Distance travelled in 25 s
Add magnitudes of both areas:
Displacement in 25 s
Add the signed areas:
Required ratio
Hence the ratio of distance to displacement in the first of motion is .
Option C is correct.
Tagged Motion graphs: x-t, v-t and a-t. Machine-assigned, so read it as a strong shortlist rather than a verdict.