JEE Main 2026 Physics question — Motion graphs: x-t, v-t and a-t
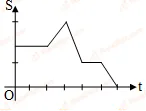
The best representing velocity -time () graph corresponding to displacement -time ( ) graph shown is
SOLUTION
To find the velocity-time graph, we need to remember that velocity is given by the slope of the displacement-time graph.
$
In the first horizontal segment, the displacement does not change with time. So, its slope is zero and hence, .
In the rising segment, the displacement increases uniformly with time. Therefore, the slope is positive and constant, say .
In the steep falling segment, the displacement decreases rapidly. So, the slope is negative and has a larger magnitude, say .
In the next horizontal segment, the displacement is constant again, so .
In the final falling segment, the displacement decreases with a smaller negative slope. Hence, .
Therefore, the velocity changes as $.
Tagged Motion graphs: x-t, v-t and a-t. Machine-assigned, so read it as a strong shortlist rather than a verdict.