JEE Main 2025 Physics question — Motion graphs: x-t, v-t and a-t
The displacement x versus time graph is shown below.
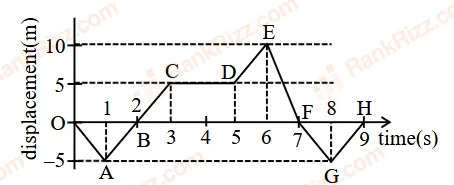
(A) The average velocity during 0 to 3 s is 10 m/s
(B) The average velocity from 3 to 5 s is 0 m/s
(C) The instantaneous velocity at t = 2 s is 5 m/s
(D) The average velocity during 5 to 7 s and instantaneous velocity at t = 6.5 s are equal
(E) The average velocity from t = 0 to t = 9 s is zero
Choose the correct answer from the options given below:
SOLUTION
First, remember:
- Slope of x-t graph = velocity
- Straight line constant velocity
- Horizontal line zero velocity
- Average velocity = (final position − initial position) / time
(A) Average velocity from 0 to 3 s
From the graph:
So,
Given statement says which is clearly wrong.
So, (A) is false
(B) Average velocity from 3 to 5 s
From graph:
So displacement does not change
This means the object is at rest.
So, (B) is true
(C) Instantaneous velocity at t=2 s
At t=2, the graph lies on the straight line between:
Slope (velocity) of this line:
Since it’s a straight line, velocity is constant in that region.
So, (C) is true
(D) Compare velocities
Average velocity from 5 to 7:
Instantaneous velocity at 6.5 s:
This lies between t=6 and t=7, where graph is a straight line from:
- (6,10)to (7,0)
Clearly:
So, (D) is false
(E) Average velocity from 0 to 9 s
- At t=0, x=0
- At t=9, x=0
So, (E) is true
Final Answer:
(B), (C), (E) only
Tagged Motion graphs: x-t, v-t and a-t. Machine-assigned, so read it as a strong shortlist rather than a verdict.