JEE Main 2021 Physics question — Motion graphs: x-t, v-t and a-t
The velocity-displacement graph describing the motion of a bicycle is shown in the figure.
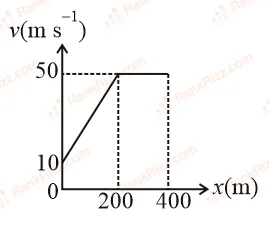
The acceleration-displacement graph of the bicycle's motion is best described by:
SOLUTION
We need to determine the acceleration-displacement () graph from the given velocity-displacement () graph of the bicycle's motion.
The acceleration as a function of velocity and displacement is given by the relation: , where represents the slope of the graph.
Let's analyze the motion in two distinct regions based on the graph:
Region 1: From to
The graph is a straight line starting from and ending at . The equation of this straight line is of the form .
The slope of this line is: .
The intercept on the vertical axis is , so the velocity equation is: .
Substituting and into the acceleration formula gives: .
This is a straight-line equation for acceleration with a positive slope () and a vertical intercept of .
• At , the acceleration is: .
• At , the acceleration is: .
Region 2: From to
The velocity is constant at . Therefore, the slope of the graph is zero: .
Substituting this into the acceleration formula gives: .
Combining both regions, the acceleration increases linearly from to in the first 200 meters, and then drops instantly and remains at from 200 meters to 400 meters.
Therefore, the correct description matches the graph where starts at 2, rises to 10 at , and becomes 0 thereafter.
Tagged Motion graphs: x-t, v-t and a-t. Machine-assigned, so read it as a strong shortlist rather than a verdict.