JEE MAIN 2026 · 05 APR S2+4 / −1EASYTRANSCRIBED
JEE Main 2026 Physics question — Motion graphs: x-t, v-t and a-t
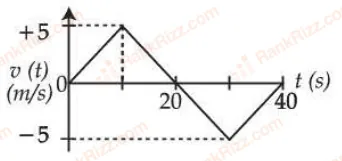
The velocity (v) versus time (t) plot of a particle is shown in the figure, for a time interval of 40 s. The total distance travelled by the particle and the and the average velocity during this period are, respectively___________,
SOLUTION
From the velocity-time graph:
- Positive triangular region from 0 to 20 s
- Negative triangular region from 20 to 40 s
Distance travelled is total area under the speed-time graph.
First triangle:
Second triangle (take magnitude):
Total distance:
Net displacement:
Average velocity:
Tagged Motion graphs: x-t, v-t and a-t. Machine-assigned, so read it as a strong shortlist rather than a verdict.