RankRizz

Motion graphs: x-t, v-t and a-t — JEE Main Previous Year Questions

Every JEE Main question on Motion graphs: x-t, v-t and a-t, one of the ideas inside Motion in a Straight Line: 30 questions from 2008–2026, 13 of them in the last five years. Newest first, answer key on every one. Free to read.

Questions

30

Years asked

12

Since

2008

Of the chapter

22%

Every Motion graphs: x-t, v-t and a-t question

21–30 OF 30 · NEWEST FIRST

JEE MAIN 2019 · 08 APR S2Motion graphs: x-t, v-t and a-tTRANSCRIBED

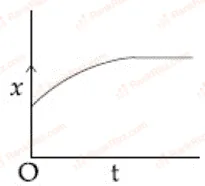
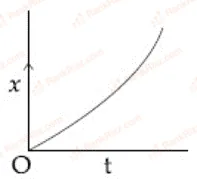
A particle starts from origin O from rest and moves with a uniform acceleration along the positive xx-axis. Identify all figures that correctly represent the motion qualitatively. (a = acceleration, v = velocity, x = displacement, t = time)
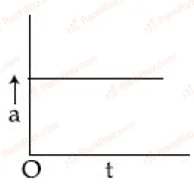
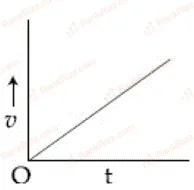
Figure for JEE Main 2019 Physics question on Motion graphs: x-t, v-t and a-t Figure for JEE Main 2019 Physics question on Motion graphs: x-t, v-t and a-t Figure for JEE Main 2019 Physics question on Motion graphs: x-t, v-t and a-t Figure for JEE Main 2019 Physics question on Motion graphs: x-t, v-t and a-t
  1. A

    A, B, D

  2. B

    A, B, C

  3. C

    B, C

  4. D

    A

JEE MAIN 2019 · 10 JAN S2Motion graphs: x-t, v-t and a-tTRANSCRIBED

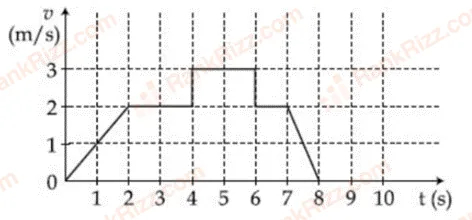
A particle starts from the origin at time t=0t = 0 and moves along the positive xx-axis. The graph of velocity with respect to time is shown in figure. What is the position of the particle at time t=5st = 5s?

Figure for JEE Main 2019 Physics question on Motion graphs: x-t, v-t and a-t
  1. A

    10 m

  2. B

    9 m

  3. C

    6 m

  4. D

    3 m

JEE MAIN 2018 · 15 APR S1Motion graphs: x-t, v-t and a-tTRANSCRIBED

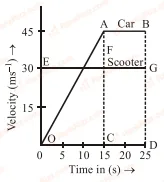
The velocity-time graphs of a car and a scooter are shown in the figure. (i) the difference between the distance travelled by the car and the scooter in 15 s and (ii) the time at which the car will catch up with the scooter are, respectively.

Figure for JEE Main 2018 Physics question on Motion graphs: x-t, v-t and a-t
  1. A

    337.5 m and 25 s

  2. B

    225.5 m and 10 s

  3. C

    112.5 m and 22.5 s

  4. D

    112.5 m and 15 s

JEE MAIN 2017 · 02 APR OFFLINEMotion graphs: x-t, v-t and a-tTRANSCRIBED

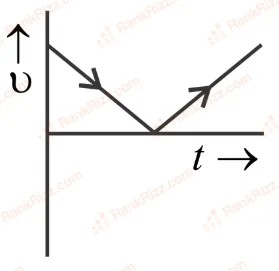
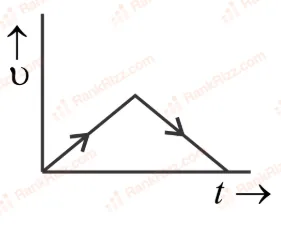
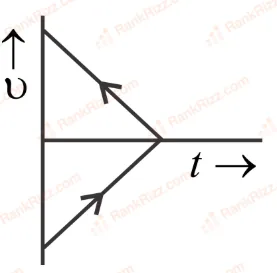
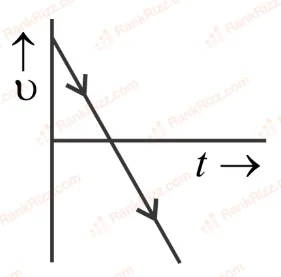
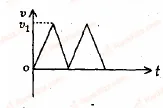
A body is thrown vertically upwards. Which one of the following graphs correctly represents the velocity vv vs time tt?

  1. A
    Figure for JEE Main 2017 Physics question on Motion graphs: x-t, v-t and a-t
  2. B
    Figure for JEE Main 2017 Physics question on Motion graphs: x-t, v-t and a-t
  3. C
    Figure for JEE Main 2017 Physics question on Motion graphs: x-t, v-t and a-t
  4. D
    Figure for JEE Main 2017 Physics question on Motion graphs: x-t, v-t and a-t
JEE MAIN 2017 · 08 APR ONLINEMotion graphs: x-t, v-t and a-tTRANSCRIBED

Which graph corresponds to an object moving with a constant negative acceleration and a positive velocity?

  1. A
    Figure for JEE Main 2017 Physics question on Motion graphs: x-t, v-t and a-t
  2. B
    Figure for JEE Main 2017 Physics question on Motion graphs: x-t, v-t and a-t
  3. C
    Figure for JEE Main 2017 Physics question on Motion graphs: x-t, v-t and a-t
  4. D
    Figure for JEE Main 2017 Physics question on Motion graphs: x-t, v-t and a-t
JEE MAIN 2012Motion graphs: x-t, v-t and a-tTRANSCRIBED

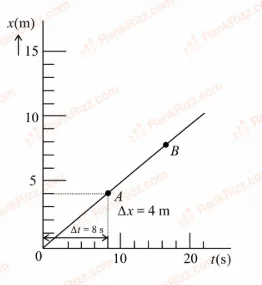
The graph of an object's motion (along the xx-axis) is shown in the figure. The instantaneous velocity of the object at points AA and BB are vAv_A and vBv_B respectively. Then

Figure for JEE Main 2012 Physics question on Motion graphs: x-t, v-t and a-t
  1. A

    vA=vB=0.5 m/sv_A = v_B = 0.5\ \text{m/s}

  2. B

    vA=0.5 m/s<vBv_A = 0.5\ \text{m/s} < v_B

  3. C

    vA=0.5 m/s>vBv_A = 0.5\ \text{m/s} > v_B

  4. D

    vA=vB=2 m/sv_A = v_B = 2\ \text{m/s}

JEE MAIN 2012Motion graphs: x-t, v-t and a-tTRANSCRIBED

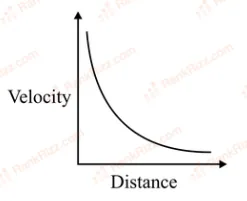
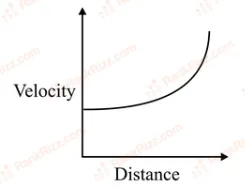
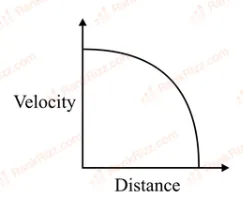
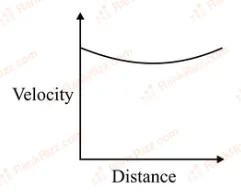
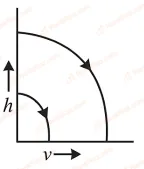
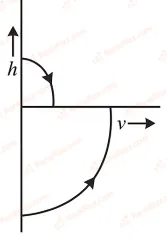
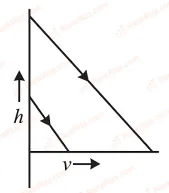
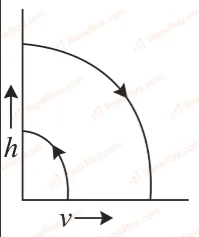
A ball is dropped vertically downwards from a height hh above the ground. It hits the ground inelastically and bounces up vertically. Neglecting subsequent motion and air resistance, which of the following graph represents variation between speed (vv) and height (hh) correctly?

  1. A
    Figure for JEE Main 2012 Physics question on Motion graphs: x-t, v-t and a-t
  2. B
    Figure for JEE Main 2012 Physics question on Motion graphs: x-t, v-t and a-t
  3. C
    Figure for JEE Main 2012 Physics question on Motion graphs: x-t, v-t and a-t
  4. D
    Figure for JEE Main 2012 Physics question on Motion graphs: x-t, v-t and a-t
JEE MAIN 2012Motion graphs: x-t, v-t and a-tTRANSCRIBED

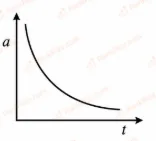
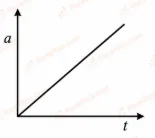
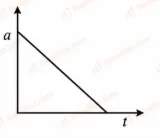
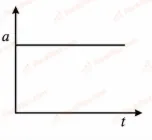
The distance travelled by a body moving along a line in time tt is proportional to t3t^3. The acceleration-time (a,t)(a, t) graph for the motion of the body will be

  1. A
    Figure for JEE Main 2012 Physics question on Motion graphs: x-t, v-t and a-t
  2. B
    Figure for JEE Main 2012 Physics question on Motion graphs: x-t, v-t and a-t
  3. C
    Figure for JEE Main 2012 Physics question on Motion graphs: x-t, v-t and a-t
  4. D
    Figure for JEE Main 2012 Physics question on Motion graphs: x-t, v-t and a-t
JEE MAIN 2009Motion graphs: x-t, v-t and a-tTRANSCRIBED

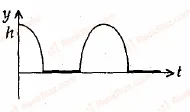
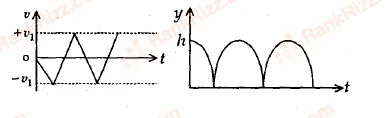
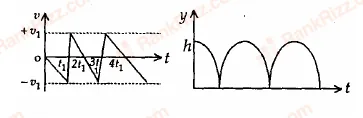
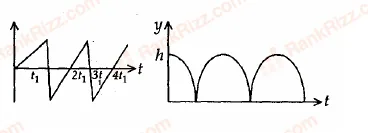
Consider a rubber ball freely falling from a height h=4.9h = 4.9 m onto a horizontal elastic plate. Assume that the duration of collision is negligible and the collision with the plate is totally elastic. Then the velocity as a function of time the height as function of time will be

  1. A
    Figure for JEE Main 2009 Physics question on Motion graphs: x-t, v-t and a-t
  2. B
    Figure for JEE Main 2009 Physics question on Motion graphs: x-t, v-t and a-tFigure for JEE Main 2009 Physics question on Motion graphs: x-t, v-t and a-t
  3. C
    Figure for JEE Main 2009 Physics question on Motion graphs: x-t, v-t and a-t
  4. D
    Figure for JEE Main 2009 Physics question on Motion graphs: x-t, v-t and a-t
JEE MAIN 2008Motion graphs: x-t, v-t and a-tTRANSCRIBED

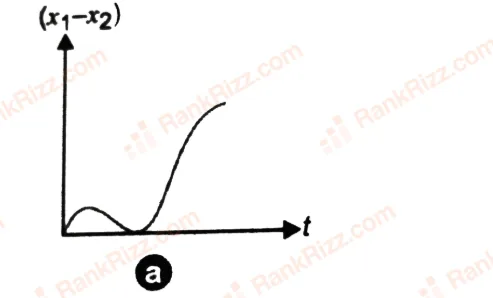
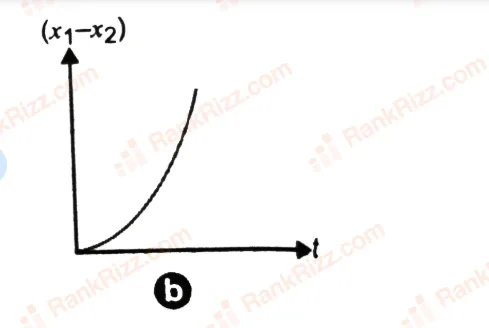
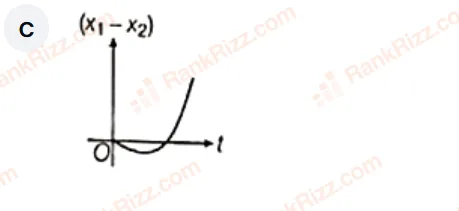
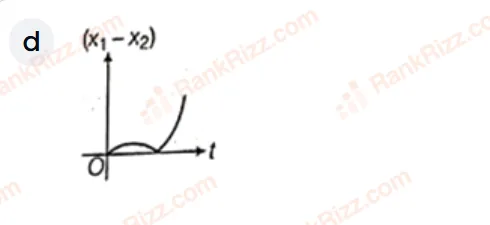
A body is at rest at x=0x = 0. At t=0t = 0, it starts moving in the positive xx-direction with a constant acceleration. At the same instant another body passes through x=0x = 0 moving in the positive xx direction with a constant speed. The position of the first body is given by x1(t)x_1(t) after time 'tt' and that of the second body by x2(t)x_2(t) after the same time interval. Which of the following graphs correctly describes (x1−x2)(x_1 - x_2) as a function of time 'tt'?

  1. A
    A
  2. B
    B
  3. C
    C
  4. D
    D