JEE MAIN 2017 · 09 APR ONLINEWork done in thermodynamic processes and P-V diagramsTRANSCRIBED
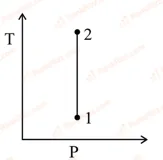
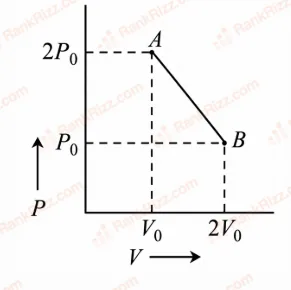
For the diagram given for an ideal gas
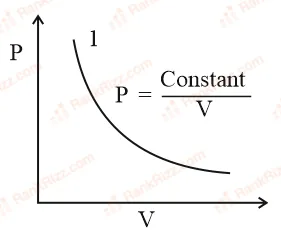
Out of the following which one correctly represents the diagram?
- A
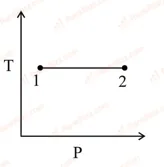
- B
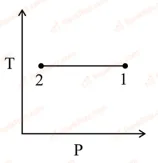
- C
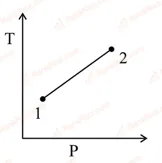
- D
Every JEE Main question on Work done in thermodynamic processes and P-V diagrams, one of the ideas inside Thermodynamics: 30 questions from 2009–2026, 11 of them in the last five years. Newest first, answer key on every one. Free to read.
Questions
30
Years asked
15
Since
2009
Of the chapter
16%
21–30 OF 30 · NEWEST FIRST
For the diagram given for an ideal gas
Out of the following which one correctly represents the diagram?
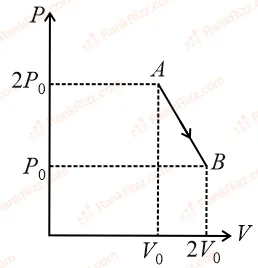
moles of an ideal gas undergoes a process as shown in the figure. The maximum temperature of the gas during the process will be:
An ideal gas goes through a reversible cycle has the V - T diagram shown below. Process and are adiabatic.
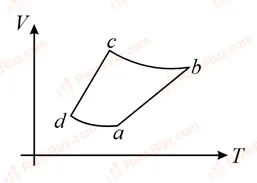
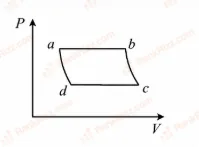
The corresponding P - V diagram for the process is (all figures are schematic and not drawn to scale):
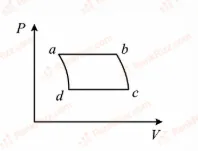
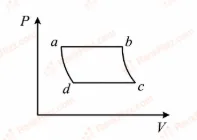
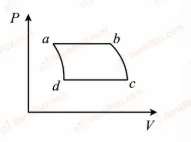
A sample of gas expands from to . In which of the following, the work done will be greatest?
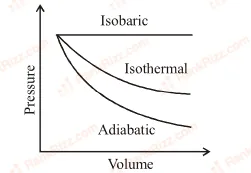
Same in all processes
Isobaric process
Isothermal process
Adiabatic process
A certain amount of gas is taken through a cyclic process (A B C D A) that has two isobars, one isochore and one isothermal. The cycle can be represented on a P - V indicator diagram as :
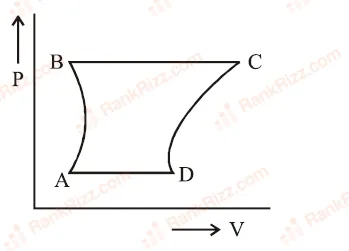
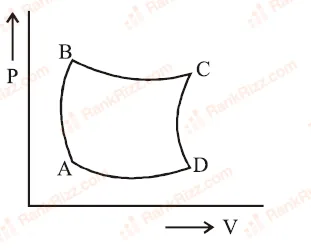
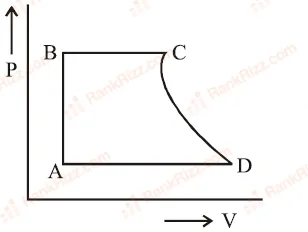
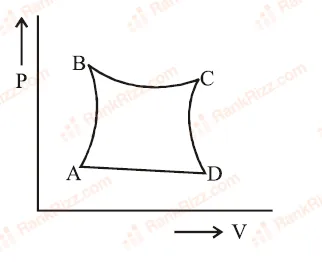
The pressure of an ideal gas varies with volume as , where is a constant. One mole of the gas is allowed to undergo expansion such that its volume becomes times its initial volume. The work done by the gas in the process is
moles of an ideal gas undergo a process as shown in the figure. Maximum temperature of the gas during the process is
Directions: Questions 7 to 9 are based on the following figure showing a thermodynamic cycle ABCDA on a P-V diagram. (Figure not available; the cycle ABCDA involves gas state changes with given pressure-volume values from the original paper.) Assuming the gas to be ideal the work done on the gas in taking it from to is
The work done on the gas in taking it from to is
The net work done on the gas in the cycle ABCDA is
Zero