JEE MAIN 2015 · 10 APR ONLINE+4 / −1MEDIUMTRANSCRIBED
JEE Main 2015 Physics question — Work done in thermodynamic processes and P-V diagrams
An ideal gas goes through a reversible cycle has the V - T diagram shown below. Process and are adiabatic.
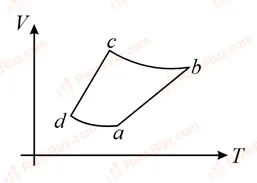
The corresponding P - V diagram for the process is (all figures are schematic and not drawn to scale):
SOLUTION
(a b): V,T Isobaric expansion horizontal line rightward in P − V
(b c): V,T Adiabatic expansion curve downwards (right)
(c d): V,T Isobaric compression horizontal line leftward
(d a): V,T Adiabatic compression curve upwards (left)
Option (A) correctly represents this behaviour.
Tagged Work done in thermodynamic processes and P-V diagrams. Machine-assigned, so read it as a strong shortlist rather than a verdict.