JEE MAIN 2013 · 22 APR ONLINE+4 / −1MEDIUMTRANSCRIBED
JEE Main 2013 Physics question — Work done in thermodynamic processes and P-V diagrams
A certain amount of gas is taken through a cyclic process (A B C D A) that has two isobars, one isochore and one isothermal. The cycle can be represented on a P - V indicator diagram as :
SOLUTION
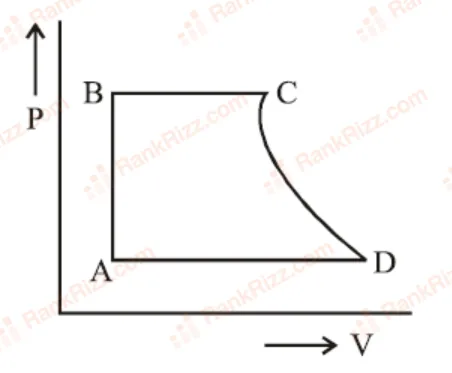
Two Isobars: Processes BC and AD are horizontal lines.
One Isochore: Process AB is a vertical line.
One Isothermal: Process CD is a hyperbolic curve.
Tagged Work done in thermodynamic processes and P-V diagrams. Machine-assigned, so read it as a strong shortlist rather than a verdict.