JEE MAIN 2018 · 15 APR S1+4 / −1MEDIUMTRANSCRIBED
JEE Main 2018 Physics question — Motion graphs: x-t, v-t and a-t
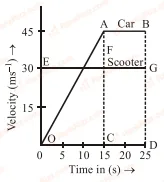
The velocity-time graphs of a car and a scooter are shown in the figure. (i) the difference between the distance travelled by the car and the scooter in 15 s and (ii) the time at which the car will catch up with the scooter are, respectively.
SOLUTION
Till 15 sec car has accelerative motion and scooter has constant velocity in entire motion.
Total Distance travelled by the car in 15 sec, = (15)2 = m
Distance travelled by scooter in 15 sec.
= V t = 30 15 = 450 m
Difference between distance travelled by the car and scooter in 15 sec,
= 450 = 112.5 m
Now, assume car catches the scooter in time t,
Car travelled in t sec = scooter travelled in t sec.
+ 45(t 15) = 30 t
337.5 + 45t 675 = 30t
15 t = 337.5
t = 22.5 sec.
Total Distance travelled by the car in 15 sec, = (15)2 = m
Distance travelled by scooter in 15 sec.
= V t = 30 15 = 450 m
Difference between distance travelled by the car and scooter in 15 sec,
= 450 = 112.5 m
Now, assume car catches the scooter in time t,
Car travelled in t sec = scooter travelled in t sec.
+ 45(t 15) = 30 t
337.5 + 45t 675 = 30t
15 t = 337.5
t = 22.5 sec.
Tagged Motion graphs: x-t, v-t and a-t. Machine-assigned, so read it as a strong shortlist rather than a verdict.