JEE Main 2021 Physics question — Calorimetry and specific heat capacity
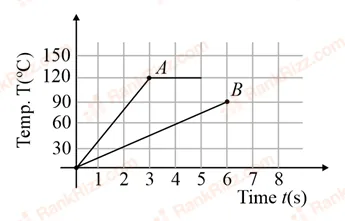
Two different metal bodies A and B of equal mass are heated at a uniform rate under similar conditions. The variation of temperature of the bodies is graphically represented as shown in the figure. The ratio of specific heat capacities is:
SOLUTION
We know that the heat supplied per unit time is the power. If a body of mass is heated at a constant rate (power) , then during a small interval of time the heat given is .
The calorimetric relation for a temperature rise says where is the specific heat capacity and is the corresponding rise in temperature.
Substituting in the calorimetric relation, we obtain
Rearranging, the rate of rise of temperature becomes
The quantity is the slope of the temperature-time graph. Hence the slope of that graph is
For the two metal blocks A and B the mass and the heating power are identical, therefore
Thus the ratio of their specific heat capacities is the inverse ratio of the slopes:
We now read the slopes directly from the straight-line portions of the given graph. Choosing the first interval (any convenient interval gives the same result):
For body A the temperature rises from to so
and hence
During the same time the temperature of body B rises from to giving
so that
Taking their ratio,
Substituting this into gives
Hence, the correct answer is Option B.
Tagged Calorimetry and specific heat capacity. Machine-assigned, so read it as a strong shortlist rather than a verdict.