JEE MAIN 2023 · 25 JAN S2+4 / −1EASYTRANSCRIBED
JEE Main 2023 Physics question — Temperature scales and thermal expansion
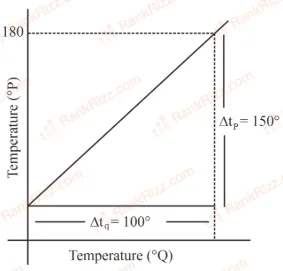
The graph between two temperature scales P and Q is shown in the figure. Between upper fixed point and lower fixed point there are 150 equal divisions of scale P and 100 divisions on scale Q. The relationship for conversion between the two scales is given by:
SOLUTION
Use the general relation for any linear temperature scales:
For scale P:
- Lower fixed point = 30
- Upper fixed point = 180
For scale Q:
- Lower fixed point = 0
- Upper fixed point = 100
So,
Tagged Temperature scales and thermal expansion. Machine-assigned, so read it as a strong shortlist rather than a verdict.