JEE Main 2019 Physics question — Photoelectric effect and Einstein's equation
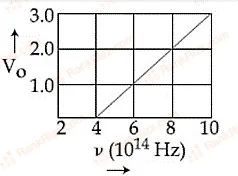
The stopping potential V (in volt) as a function of frequency () for a sodium emitter, is shown in the figure. The work function of sodium, from the data plotted in the figure, will be:
(Given: Planck's constant h = J s, electron charge (e) = C)
SOLUTION
The fundamental relation governing the photo-electric effect is Einstein’s photo-electric equation, which we first state in its usual form:
Here is the electronic charge, is the stopping potential, is Planck’s constant, is the frequency of the incident light and is the work function of the emitter.
Re-arranging the equation to express as a function of , we obtain
Thus a graph of (vertical axis) versus (horizontal axis) must be a straight line whose:
• slope is , and
• intercept on the frequency axis (where ) is the threshold frequency given by .
Looking carefully at the plotted data in the given figure, we see that the straight line meets the frequency axis (that is, ) at
Now we can calculate the work function. Putting in , we have
Substituting the numerical values
and , we get
To express the result in electron-volts, we divide by the charge of one electron (remembering that 1 eV = J):
Rounding to the number of significant figures consistent with the given data,
Hence, the correct answer is Option D.
Tagged Photoelectric effect and Einstein's equation. Machine-assigned, so read it as a strong shortlist rather than a verdict.