JEE MAIN 2023 · 30 JAN S1+4 / −1EASYTRANSCRIBED
JEE Main 2023 Physics question — Impulse and impulse-momentum theorem
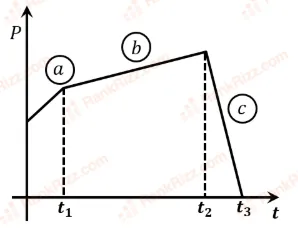
The figure represents the momentum time curve for a particle moving along an axis under the influence of the force. Identify the regions on the graph where the magnitude of the force is maximum and minimum respectively?
If
SOLUTION
Given ,
A momentum-time graph is given,
p-t
momentum p=mv
as m is constant , graph is directly proportional to v
so the slope of the graph is the acceleration
So higher the slope higher the Force
Observe the graph, order of slopes is
c>b>a
Therefore maximum force is in c and minimum force is in b
Tagged Impulse and impulse-momentum theorem. Machine-assigned, so read it as a strong shortlist rather than a verdict.