JEE MAIN 2023 · 01 FEB S2+4 / −1EASYTRANSCRIBED
JEE Main 2023 Physics question — Impulse and impulse-momentum theorem
Figures (a), (b), (c) and (d) show variation of force with time.
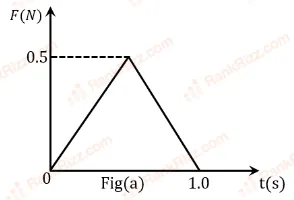
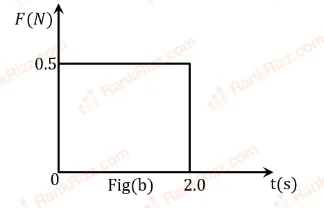
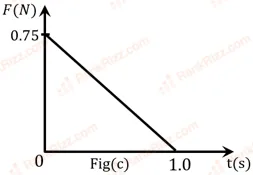
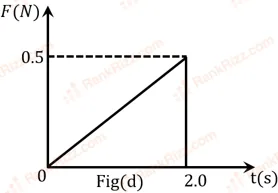
The impulse is highest in figure.
SOLUTION
To compare impulses, remember one key idea:
Impulse = area under the F-t graph
Now evaluate each figure based on its shape and dimensions:
For graph a
This is a triangle with .
Area (impulse) =
For graph B
This is a rectangle with constant force .
Area (impulse) =
For graph C
Triangle with base 1 s and height 0.75 N
Area =
For graph D
Triangle with base 2 s and height 0.5
Area =
Therefore from this we can conclude that fig(b) has the highest impulse
Tagged Impulse and impulse-momentum theorem. Machine-assigned, so read it as a strong shortlist rather than a verdict.