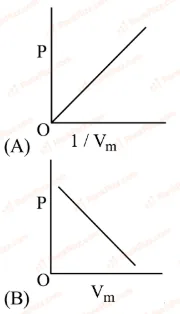
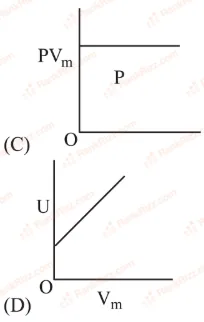
We are dealing with an ideal gas that is undergoing an isothermal expansion. By definition an isothermal process takes place at constant temperature, so the absolute temperature T does not change while the volume increases and the pressure decreases.
For an ideal gas we always have the ideal-gas equation
PV=nRT,
where n is the amount of substance, R is the universal gas constant and T is the absolute temperature. During an isothermal process both n and T remain constant, so their product nRT is a single constant, say K:
PV=K.−(1)
Equation (1) can be written in several equivalent algebraic ways, each one immediately telling us how one thermodynamic variable depends on another when the temperature is fixed:
• Solving for P gives P=VK so P∝V1.<br/>•SolvingforVgivesV=\dfrac{K}{P}soV\propto\dfrac1P.
• Solving for V1 gives V1=KP so V1∝P.<br/>•Solvingfor\dfrac1Pgives\dfrac1P=\dfrac{V}{K}so\dfrac1P\propto V.</p><p>Fromtheseproportionalitieswecanforeseethecorrectqualitativeshapesofthevariousplotsthattrulyrepresentanisothermalexpansion:</p><p>1.AplotofP(verticalaxis)versusV(horizontalaxis)mustbearectangularhyperbolathatfallscontinuouslyasVincreases.ThecurvenevercutsanaxisbecauseneitherPnorVcanbecomezeroforafinitetemperature.</p><p>2.AplotofPversus\dfrac1VmustbeastraightlinepassingthroughtheoriginbecauseP=K\left(\dfrac1V\right).TheslopeofthisstraightlineistheconstantK.</p><p>3.AplotofVversus\dfrac1PmustalsobeastraightlinethroughtheoriginbecauseV=K\left(\dfrac1P\right).</p><p>4.Aplotof\dfrac1Pversus\dfrac1Vwillagainbearectangularhyperbola:multiplyingthetwoplottedvariablesyields\left(\dfrac{1}{P}\right)\left(\dfrac{1}{V}\right)=\dfrac{1}{K},anotherconstant.</p><p>Anydiagramthatshowsa<em>direct</em>proportionality(P\propto Vor\dfrac1P\propto\dfrac1V)ora<em>horizontal/verticalline</em>(whichwouldkeepeithervariablefixed)clearlycontradictstheinverserelationshipslistedabove,andthereforecannotcorrespondtoanisothermalexpansion.</p><p>Whenweinspectthefourdiagramssuppliedinthepaper,figures(A),(B),(C)and(D),weobservethefollowingqualitativefeatures:</p><p>•Figure(A)depictsafallingrectangularhyperbolaintheP−Vplane,fullyconsistentwithPV=K.
• Figure (B) depicts a straight line with a positive slope in the P-V plane, passing through the origin, i.e. it suggests P∝V, which contradicts Eq. (1).<br/>•Figure(C)depictsastraightlinethroughtheoriginintheVversus\dfrac1Pplane,exactlymatchingV=\dfrac{K}{P}.Hencethis<em>is</em>anisothermalgraph.<br/>•Figure(D)depictsastraightlinewithapositiveslopeinthe\dfrac1Pversus\dfrac1Vplane,thatis\dfrac1P\propto\dfrac1V.Multiplyingthetwoaxesvariablesnowyields\left(\dfrac{1}{P}\right)\left(\dfrac{1}{V}\right)\propto\dfrac{1}{V}⋅\dfrac{1}{V}=\dfrac{1}{V^{2}},whichiscertainly<em>not</em>theconstant\dfrac1K$$ required by Eq. (1). So this figure also violates the isothermal condition.
Combining these observations, we see that diagrams (B) and (D) fail to obey the inverse proportionalities mandated by the ideal-gas law at constant temperature, and therefore do not represent an isothermal expansion. The remaining diagrams (A) and (C) obey Eq. (1) and are acceptable.
Among the answer choices provided, option C lists exactly the pair (B) and (D).
Hence, the correct answer is Option C.