JEE ADVANCED 2008 · PAPER 2MEDIUMTRANSCRIBED
JEE Advanced 2008 Physics question — Spring-block oscillations
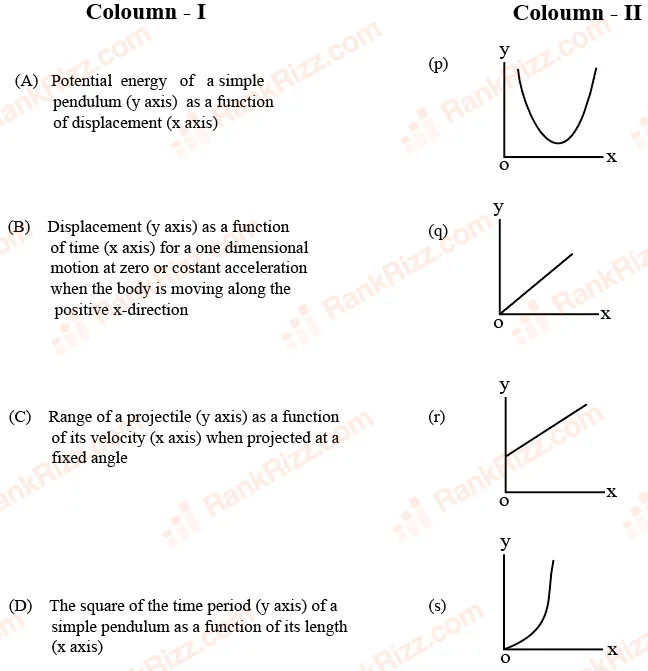
Column I gives a list of possible set of parameters measured in some experiments. The variations of the parameters in the form of graphs are shown in Column II. Match the set of parameters given in Column I with the graphs given in Column II. Indicate your answer by darkening the appropriate bubbles of the matrix given in the ORS.
ANSWER UNDER REVIEW
Answer under review. The key we hold for this question has not been checked, so it is not graded and no answer is shown until it is.
Tagged Spring-block oscillations. Machine-assigned, so read it as a strong shortlist rather than a verdict.