RankRizz
JEE MAIN 2020 · 08 JAN S1+4 / −1MEDIUMTRANSCRIBED

JEE Main 2020 Physics question — Work done in thermodynamic processes and P-V diagrams

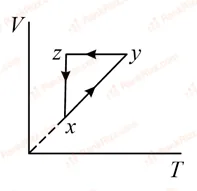
A thermodynamic cycle xyzx is shown on a V-T diagram.

Figure for JEE Main 2020 Physics question on Work done in thermodynamic processes and P-V diagrams


The P-V diagram that best describes this cycle is: (Diagrams are schematic and not to scale)

SOLUTION

For process x→yx \to y:  V∝T  ⟹  P=constant (Isobaric)V \propto T \implies P = \text{constant (Isobaric)}

Volume increases, so it’s a horizontal line pointing right.\text{Volume increases, so it's a horizontal line pointing right.}

For process y→zy \to z: V=constant (Isochoric)V = \text{constant (Isochoric)}

Temperature decreases   ⟹  P decreases, so it’s a vertical line pointing down.\text{Temperature decreases } \implies P \text{ decreases, so it's a vertical line pointing down.}

For process z→xz \to x:  T=constant (Isothermal)T = \text{constant (Isothermal)}

Volume decreases   ⟹  P∝1V increases, so it’s a hyperbolic curve rising up.\text{Volume decreases } \implies P \propto \frac{1}{V} \text{ increases, so it's a hyperbolic curve rising up.}

Tagged Work done in thermodynamic processes and P-V diagrams. Machine-assigned, so read it as a strong shortlist rather than a verdict.

SubjectPhysics
TopicWork done in thermodynamic processes and P-V diagrams
TypeMultiple choice