RankRizz
JEE MAIN 2014 · 19 APR ONLINE+4 / −1MEDIUMTRANSCRIBED

JEE Main 2014 Physics question — Magnetic flux, Faraday's law and Lenz's law

The figure shows a circular area of radius R where a uniform magnetic field B⃗\vec{B} is going into the plane of the paper and increasing in magnitude at a constant rate. In that case, which of the following graphs, drawn schematically, correctly shows the variation of the induced electric field E(r)?
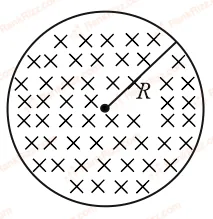
Figure for JEE Main 2014 Physics question on Magnetic flux, Faraday's law and Lenz's law
SOLUTION

∮E⃗⋅dl⃗=−dΦBdt\oint \vec{E} \cdot d\vec{l} = -\frac{d\Phi_B}{dt}

Case 1: Inside the Magnetic Field Region (r≤Rr \le R)

ΦB=B⋅(πr2)\Phi_B = B \cdot (\pi r^2)

E(2πr)=ddt(B⋅πr2)=πr2dBdtE(2\pi r) = \frac{d}{dt} \left( B \cdot \pi r^2 \right) = \pi r^2 \frac{dB}{dt}

E(2πr)=πr2⋅kE(2\pi r) = \pi r^2 \cdot k

E=k2⋅r  ⟹  E∝rE = \frac{k}{2} \cdot r \implies E \propto r

Thus, inside the region, the induced electric field increases linearly with distance rr, starting from zero at the center.

Case 2: Outside the Magnetic Field Region (r>Rr > R)

ΦB=B⋅(πR2)\Phi_B = B \cdot (\pi R^2)

E(2πr)=ddt(B⋅πR2)=πR2dBdtE(2\pi r) = \frac{d}{dt} \left( B \cdot \pi R^2 \right) = \pi R^2 \frac{dB}{dt}

E(2πr)=πR2⋅kE(2\pi r) = \pi R^2 \cdot k

E=kR22⋅1r  ⟹  E∝1rE = \frac{k R^2}{2} \cdot \frac{1}{r} \implies E \propto \frac{1}{r}

Thus, outside the region, the induced electric field decreases hyperbolically as 1r\frac{1}{r}.

Hence, the graph in option (A) correctly represents this.

Tagged Magnetic flux, Faraday's law and Lenz's law. Machine-assigned, so read it as a strong shortlist rather than a verdict.

SubjectPhysics
TopicMagnetic flux, Faraday's law and Lenz's law
TypeMultiple choice