JEE Main 2019 Physics question — Ohm's law, resistance, resistivity and colour code
In an experiment, the resistance of a material is plotted as a function of temperature (in some range). As shown in the figure, it is a straight line.
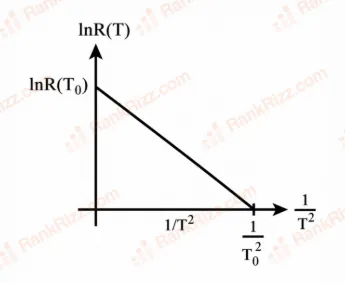
One may conclude that
SOLUTION
Step-by-Step Solution
1. Identify the Equation of a Straight Line
From the statement, the graph plotted is a straight line. The standard equation for a downward-sloping straight line with a positive vertical intercept is given by:
Where:
- represents the variable on the vertical axis.
- represents the variable on the horizontal axis.
- is the positive slope magnitude.
- is the positive vertical intercept.
- The vertical axis variable () is .
- The horizontal axis variable () is .
2. Match Axis Variables to the Graph
By looking at the provided mathematical steps:
Substituting these coordinates into the straight-line equation:
3. Convert logarithmic form to Exponential form
To find the direct relationship for resistance as a function of temperature , take the exponential base on both sides of the equation:
Using exponential properties ():
Let the constant term be defined as the baseline resistance , and the slope constant be defined as a characteristic temperature squared parameter :
Substituting these constants back gives the function:
Final Answer
The variation of resistance with temperature that satisfies the linear graph is given by the exponential relationship:
Tagged Ohm's law, resistance, resistivity and colour code. Machine-assigned, so read it as a strong shortlist rather than a verdict.