JEE MAIN 2020 · 02 SEP S1+4 / −1MEDIUMTRANSCRIBED
JEE Main 2020 Chemistry question — Gas laws and ideal gas equation
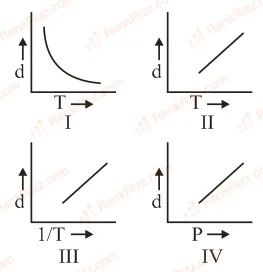
Which one of the following graphs is not correct for ideal gas?
d = Density, P = Pressure, T = Temperature
SOLUTION
The ideal gas equation can be rewritten to express density by combining the basic gas law with molecular weight properties:
Rearranging the equation to solve for density () gives:
Isolating the density (), we get our working formula:
Step-by-Step Analysis of Each Graph:
-
Graph I: vs (at constant )
- From the formula, keeping constant means density is inversely proportional to temperature: .
- The graph of an inverse relationship is a rectangular hyperbola.
- Status: Graph I is correct.
-
Graph II: vs (at constant )
- As established above, and share an inverse relationship (). As temperature increases, gas volume expands, causing the density to decrease.
- Graph II depicts a linear increase with a positive slope (), which is physically impossible for an ideal gas.
- Status: Graph II is incorrect.
-
Graph III: vs (at constant )
- Since , plotting directly against the inverse of temperature () yields a linear relationship ().
- The graph should be a straight line passing through the origin.
- Status: Graph III is correct.
-
Graph IV: vs (at constant )
- Keeping constant means density is directly proportional to pressure: .
- The graph should be a straight line passing through the origin with a positive slope.
- Status: Graph IV is correct.
Conclusion:
Because density is inversely related to temperature at a constant pressure, Graph II is geometrically and scientifically flawed.
Answer: Option B — II
Tagged Gas laws and ideal gas equation. Machine-assigned, so read it as a strong shortlist rather than a verdict.