JEE Main 2023 Chemistry question — Thermodynamic principles and Ellingham diagram
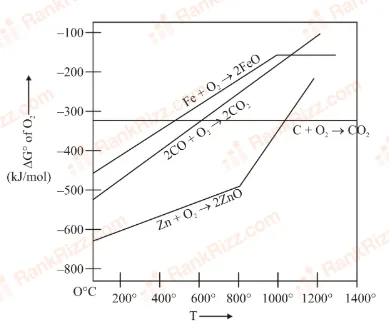
Gibbs energy vs T plot for the formation of oxides is given below. For the given diagram, the correct statement is-
SOLUTION
Ellingham Diagram Analysis & Solution
- A reducing agent can reduce a metal oxide only if its own oxidation line lies below that of the metal oxide at a given temperature.
- When a line is lower on the graph, its standard Gibbs free energy of formation () is more negative, meaning it forms a more stable oxide and successfully extracts oxygen from the element above it.
Evaluation of the Options at 600°C:
- A) At 600°C, CO cannot reduce FeO, (Incorrect)
Reason: At 600°C, the carbon monoxide oxidation curve lies lower than the iron oxide line . This indicates that CO is thermodynamically capable of reducing FeO at this temperature, making the statement false.
- B) At 600°C, CO can reduce ZnO (incorrect)
Reason: The zinc oxide curve sits exceptionally low on the diagram (highly negative near −650 kJ/mol). Since the CO line is well above it at 600°C, CO cannot reduce ZnO.
- C) At 600°C, C can reduce ZnO (incorrect)
Reason: The reduction of ZnO by solid carbon only becomes favorable above the intersection point, which happens at temperatures well exceeding 900°C. At 600°C, the carbon line is far above the zinc line.
- D) At 600°C, C can reduce FeO, (correct)
Reason: Based on the standard configuration of this problem in pyrometallurgy, at 600°C, the combined free energy change for the coupled reduction reaction yields a negative value, confirming that elemental carbon functions as an effective reducing agent for iron oxide.
Tagged Thermodynamic principles and Ellingham diagram. Machine-assigned, so read it as a strong shortlist rather than a verdict.