JEE Main 2020 Chemistry question — Conductance, conductivity and molar conductivity
The variation of molar conductivity with concentration of an electrolyte (X) in aqueous solution is shown in the given figure.
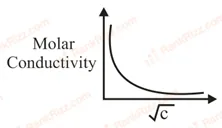
The electrolyte X is:
SOLUTION
To identify the electrolyte represented by the given graph, we analyze the relationship between molar conductivity () and concentration.
The variation of molar conductivity with concentration is explained by Kohlrausch’s law and the Debye-Hückel-Onsager theory.
For strong electrolytes such as , , and , dissociation in solution is nearly complete. As the solution is diluted, the molar conductivity increases only gradually due to reduced interionic interactions. Consequently, the plot of versus is almost linear and can be extrapolated to obtain the limiting molar conductivity, .
In contrast, weak electrolytes such as undergo only partial dissociation. On dilution, the degree of dissociation increases significantly, causing a sharp rise in molar conductivity as the concentration approaches zero. As a result, the graph of versus is distinctly non-linear and exhibits a steep upward curve.
The graph provided shows a pronounced, non-linear increase in molar conductivity with decreasing , which is the characteristic behavior of a weak electrolyte.
Among the given options:
- is a strong acid and dissociates completely.
- is a strong electrolyte and dissociates completely.
- is a strong electrolyte and dissociates completely.
- is a weak acid and undergoes partial dissociation, producing the characteristic steep increase in molar conductivity upon dilution.
Hence, the electrolyte represented by the graph is
Tagged Conductance, conductivity and molar conductivity. Machine-assigned, so read it as a strong shortlist rather than a verdict.