JEE MAIN 2019 · 09 APR S1+4 / −1EASYTRANSCRIBED
JEE Main 2019 Chemistry question — Integrated rate laws and half-life (zero and first order)
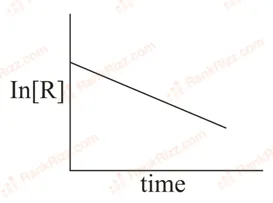
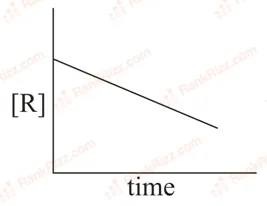
The given plots represent the variation of the concentration of a reactant R with time for two different reactions (i) and (ii). The respective orders of the reaction are:
SOLUTION
For 1st order reaction, we know
- = kt
= - kt +
So, vs t is a straight line with negative slope.
First graph represent 1st order reaction.
For zero order reaction, we know
R0 - Rt = kt
Rt = - kt + R0
So, vs t is a straight line with negative slope.
Second graph represent zero order reaction.
- = kt
= - kt +
So, vs t is a straight line with negative slope.
First graph represent 1st order reaction.
For zero order reaction, we know
R0 - Rt = kt
Rt = - kt + R0
So, vs t is a straight line with negative slope.
Second graph represent zero order reaction.
Tagged Integrated rate laws and half-life (zero and first order). Machine-assigned, so read it as a strong shortlist rather than a verdict.